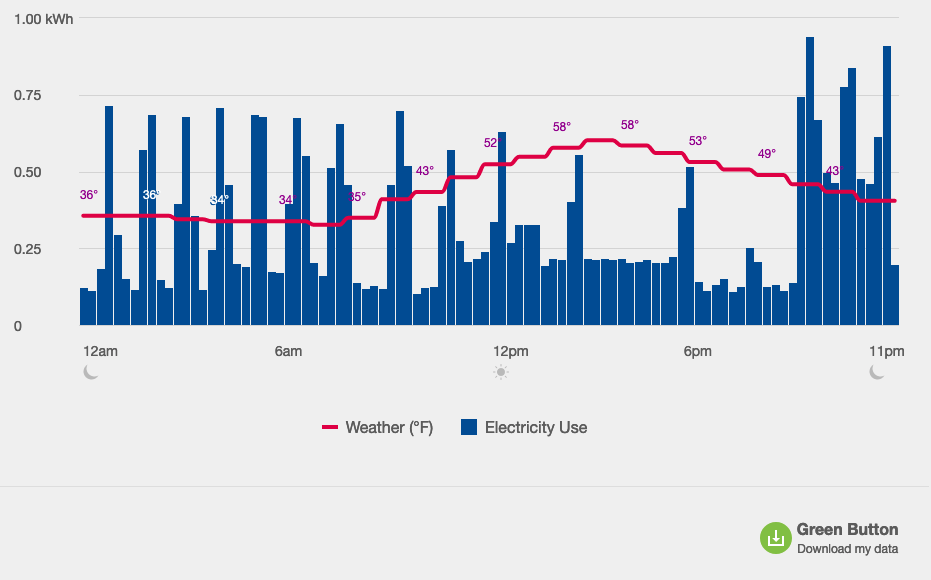
My electric utility gives me nice a good amount of data, including a download button! This made me want to get this data into Grafana so I could explore it better.

Getting the data
That “Download my data” button is tempting. The data ends up looking like:
TYPE,DATE,START TIME,END TIME,USAGE,UNITS,COST,NOTES
Electric usage,2022-01-01,00:00,00:14,0.14,kWh,$0.01,
and I noticed the API returned a little bit more like:
    {
      "startTime": "2022-01-29T00:00:00.000-06:00",
      "endTime": "2022-01-29T00:15:00.000-06:00",
      "value": 0.552,
      "readType": "ACTUAL",
      "providedCost": 0.03219264,
      "readComponents": [
        {
          "tierType": "ORDINAL",
          "tierNumber": 2,
          "season": null,
          "dayPart": null,
          "cost": 0.03219264,
          "value": 0.552
        }
      ],
      "isPeakPeriod": false,
      "rebateAmount": 0,
      "milesDriven": 0
    },
Now not all that JSON is useful, but it I also wanted that temperature data too, so I wanted to scrape the JSON instead going after the CSV.
Scraping Attempt 1: Can I just curl it?
I use my inspector’s “copy as curl”, made some tweaks, and it worked! That is until my session timed out. I tried keeping it alive, but it became clear that wasn’t going to be sustainable. Searching around, I found one other person attempted this same problem…
Scraping Attempt 2: Puppeteer
When I search for other attempted scrapers, I search for pieces of the URLs in Github. Doing that, I found https://github.com/mhoran/coned-rtu. That project uses Mechanize to do browser automation. I just had some PTSD dealing with migrating Python projects to a M1 Mac so I chose to use NodeJS instead. I had good luck writing scrapers with Puppeteer before so I chose that. After a snafu with setRequestInterception, my scraper was working.
Metrics Attempt 1: Prometheus
Prometheus is my go-to for metrics. It’s CNCF approved. The query language is amazing. What’s not to like? Well apparently two things:
- Generally, Prometheus doesn’t like gauges. Electrical consumption works well as a counter, but the data format is as a gauge
- You can’t backdate data. This data is historical, not real-time. Prometheus is designed to follow real-time data
Metrics Attempt 2: InfluxDB
I’ve known about InfluxDB and I’ve been wanting to try it. To do some due diligence, I compared it to other Grafana data sources like OpenTSDB and InfluxDB looked like the one for me. Even better, they had a hosted solution with a free tier so I could skip setting it up myself.
Final-ish product
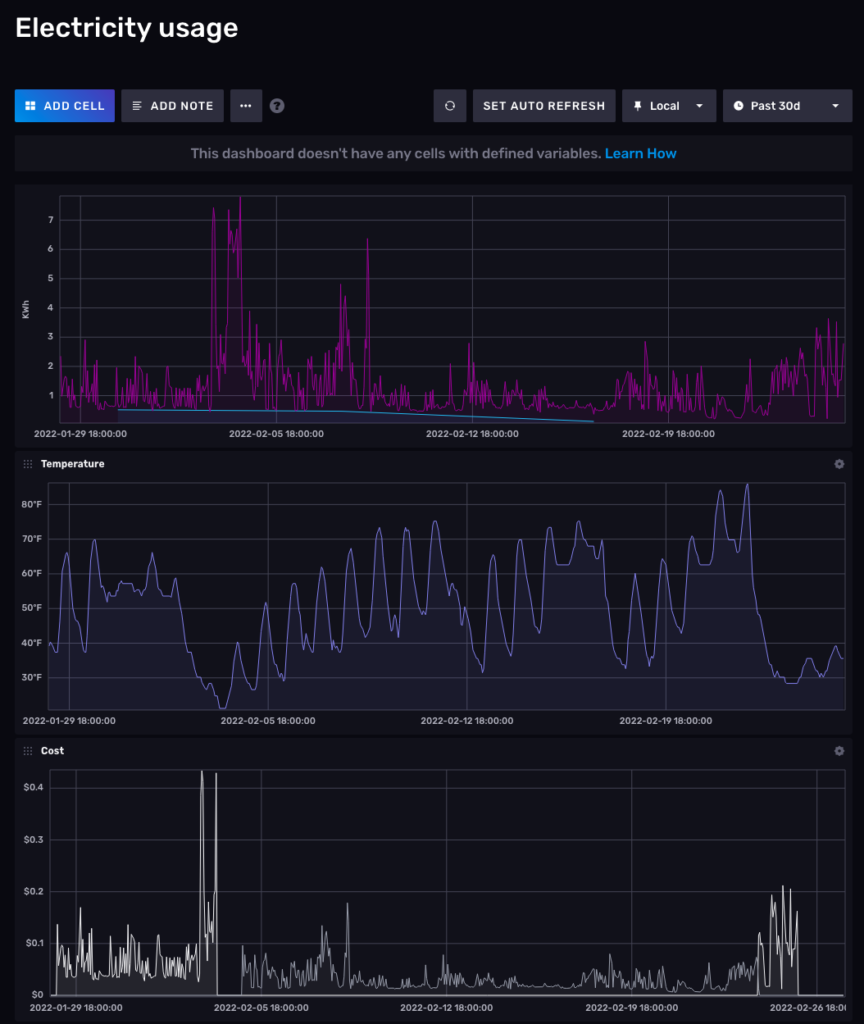
After a few hours, I was able to figure out infuxdata.com’s dashboard interface enough to get this:

There’s a lot of oddities, like why is the x-axis of the last chart off? Why is it splitting tags into different series? There are lots of features I miss from Grafana too: right-side Y-axis, shared cursors.
I pushed my code here: https://github.com/crccheck/opower-exporter
What’s next?
- Host my own InfluxDB + Grafana